

Are you a new member? Sign up now
Login area
| Sign up
Let us help you
Read about the latest topics.
Read about the latest topics.


Health System Response
Number of Hospitals contracted by the MOPH by Mohafazah and Type, 2017*
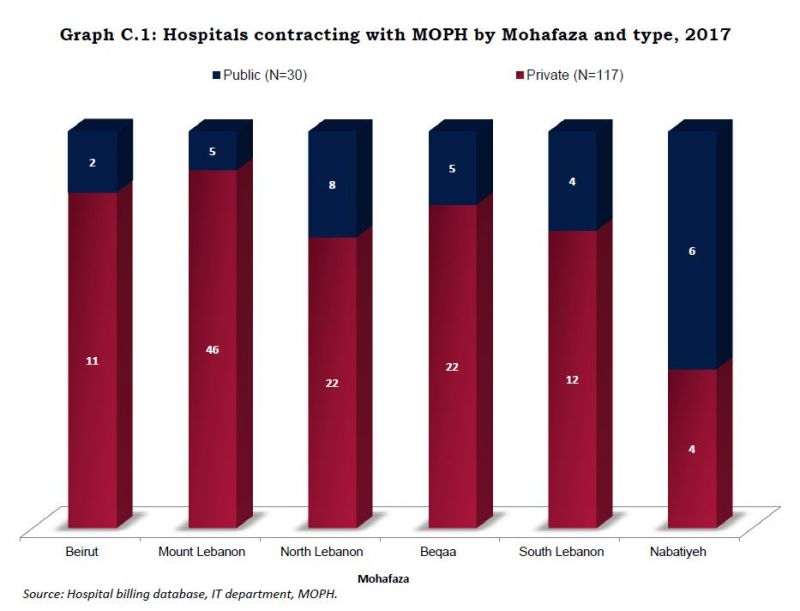
*For previous years check the Statistical Bulletins' page
Number of Admissions Subsidized by the MOPH by Qada, 2017*
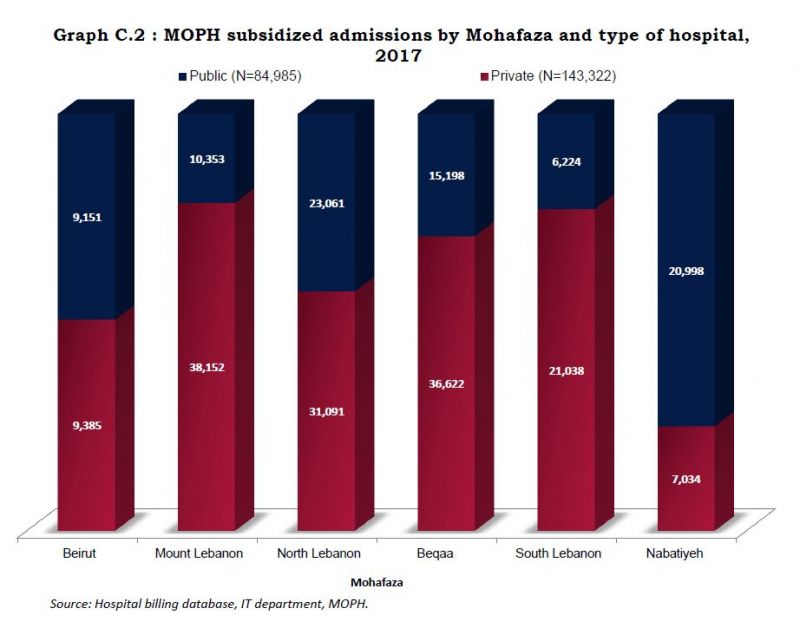
*For previous years check the Statistical Bulletins' page
*For previous years check the Statistical Bulletins' page
Number of Admissions Subsidized by the MOPH by Qada, 2017*
*For previous years check the Statistical Bulletins' page
Number of In-Patients Subsidized by the MOPH by Qada and hospital type, 2017*
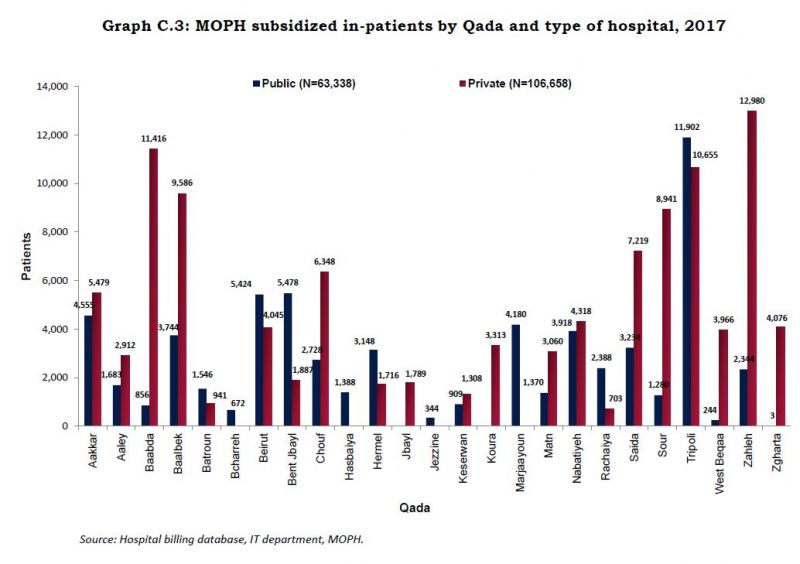
*For previous years check the Statistical Bulletins' page
*For previous years check the Statistical Bulletins' page
| Unit | 2015 | 2016 | 2017 | 2018 | 2019 | |
|---|---|---|---|---|---|---|
| Budget of the MOPH | Billion LBP | 515.9 | 642.7 | 708.5 | 728 | 743 |
| Per capita total expenditure on health (THE) | $US | 863 | - | - | - | - |
| Out-of-pocket expenditure as % of THE | Percent | 32.7 | - | - | - | - |
| Unit | 2012 | 2013 | 2014 | 2015 | 2016 | 2017 | 2018 | 2019 | 2024 | |
|---|---|---|---|---|---|---|---|---|---|---|
| Physicians | per 10,000 population | 36.5 | 31.9 | 30.7 | 32.0 | 31.0 | 31.3 | 31.2 | 33.3 | 44.8 |
| Nursing and Midwifery | per 10,000 population | 29.1 | 33.1 | 33 | 33.4 | 34.2 | 36.4 | 37.4 | 38.6 | 63.2 |
| Dentists | per 10,000 population | 12.7 | 12.6 | 12.9 | 12.9 | 15.1 | 15.2 | 15.6 | 15.6 | 20.4 |
| Pharmacists | per 10,000 population | 18.6 | 16.8 | 17.5 | 17.7 | 18.2 | 18.9 | 19.8 | 20.3 | 28.5 |
Density per million population of high tech equipment
| High tech unit | N* |
|---|---|
| Open heart surgery departments | 27 |
| Cardiac catheterization laboratories | 59 |
| Kidney transplant centers | 8 |
| Bone marrow transplant units | 6 |
| Specialized burns centers | 3 |
| CT scan machines | 110 |
| MRI machines | 41 |
| PET scan | 7 |
| Dialysis machines | 841 |
*High tech equipment in the public and private sector
*Number as provided by the Department of Projects and Programs in 2014 pertaining to the latest available figures (2012)
*Number as provided by the Department of Projects and Programs in 2014 pertaining to the latest available figures (2012)
National immunization coverage rates by polio, measles and pentavalent vaccines, 2012-2017
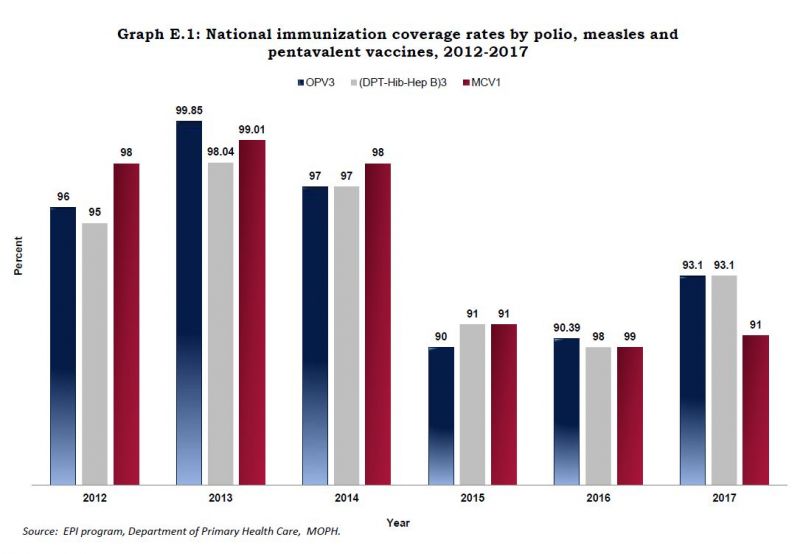
*For previous years check the Statistical Bulletins' page
.PNG)
Sitemap 
© Copyrights reserved to Ministry of Public Health 2026